A tiny logger under the saddle
KRENGO
measures what you feel in the corner
Scroll
Every cyclist knows the feeling.
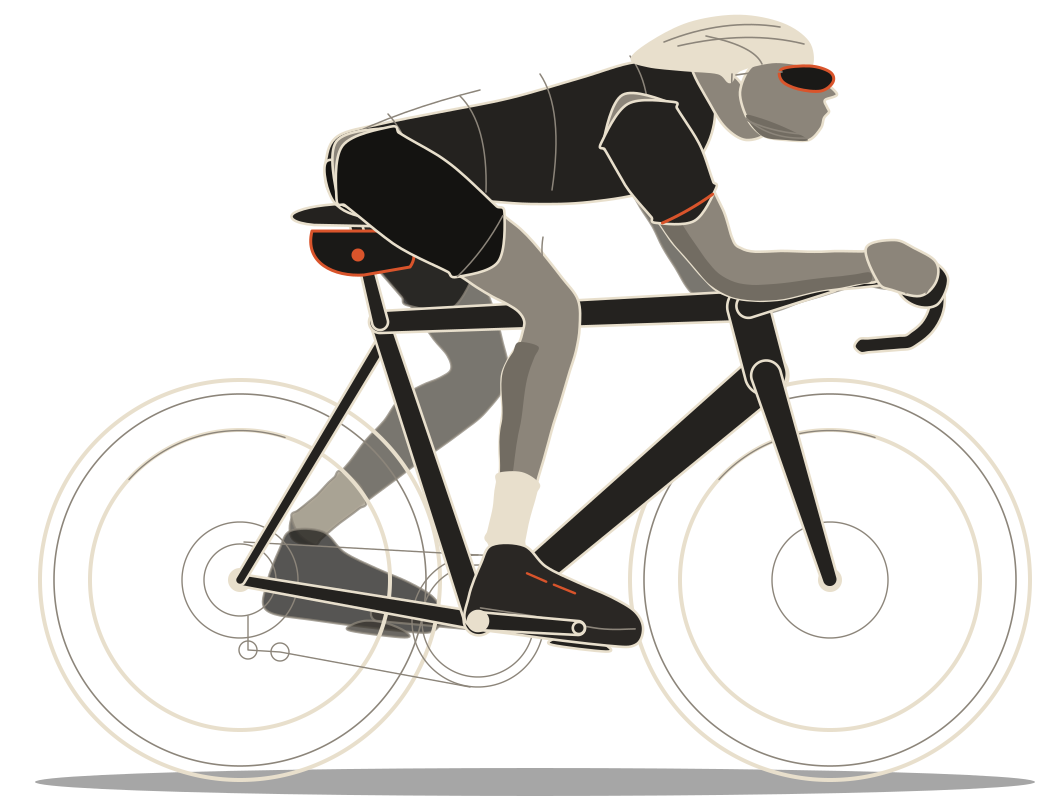
The bike leans into the corner, and for a second everything goes quiet.
Almost nobody gets to see it.
This is the story of one corner, ridden twice.
Without Krengo
Three corners. The rider only knows it feels fast.
He holds back. He brakes in. Little lean, low speed.
And pedalling? It starts late, because nobody knows when it is safe.
Illustration
Same corner. Now with the numbers in front of you.
With Krengo
Same three corners. Now the rider sees the lean as it happens.
He leans a little further, because the number says there is grip to spare. The speed stays.
And the moment it is safe, the signal comes: PEDAL NOW.
First to the line. Last lap’s ghost is still rolling.
Illustration
The difference, same corner
Illustration of a corner
Try it yourself
Tilt your phone.
This is what Krengo measures, 20 times a second. Lean your phone like a bike and watch the angle. On a computer: drag, or use ← →.
Your phone’s sensor stands in for Krengo
Where we’re headed
Here is how it could be.
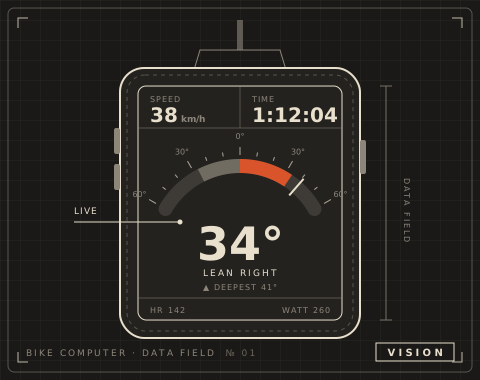
Lean angle stops being a table of numbers after the ride. It sits on your bike computer while you ride.
The road so far
Built in small, safe steps. Here is what is in place, and what is coming.
A readout that checks itself
One copy of a log was missing its first minute and nobody noticed. Now every file travels with its length and a checksum, and is rejected if they don’t match.
The box is drawn in code
The enclosure is modelled in OpenSCAD, and a separate checker derives its own dimensions from the datasheets.
Fourteen hours on one battery
The logger ran 14 h 48 min at 20 Hz, 1,066,089 rows, and only stopped when the battery ran out.
GPS cross-check and an honest README
Comparing against a real GPS ride showed a different filter, not a sensor fault.
No more drilling
One printed box on the bottle-cage bolts, no soldering. 4 h 19 min and 190 g of PETG.
Dress rehearsal on a synthetic ride
Peaks of +35°, −35° and +35° read back as 35.00°. A bug in the angle formula for a tilted sensor was found and fixed before any ride.
The box moves to the seat tube
The down tube sits too close to the chainring, so the box gets its spot on the seat tube. Next up: a clearance check on the bike.
Out on the road: first ride, first real curve
Mount, charge, ride, read out, and lay the curve next to the GPS track.
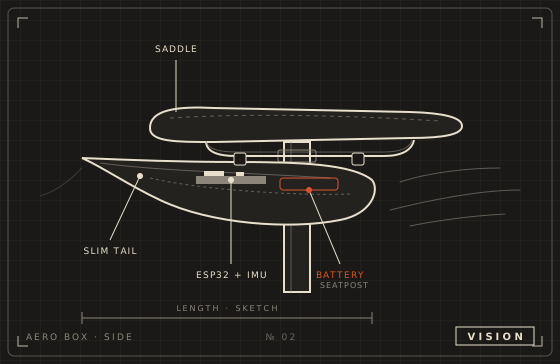
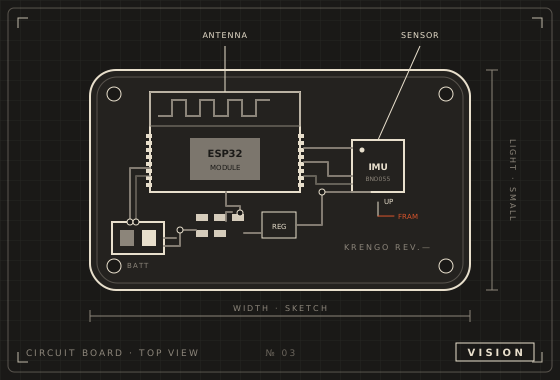
A lighter board and an aero box
Once the logger has proven itself on the road, it gets small and sleek.
The lean bar on your bike computer
Live view while you ride. Where we’re headed.
See the corner. Take it faster.
THE END
 Krengo · hobby project · no tracking, works offline